
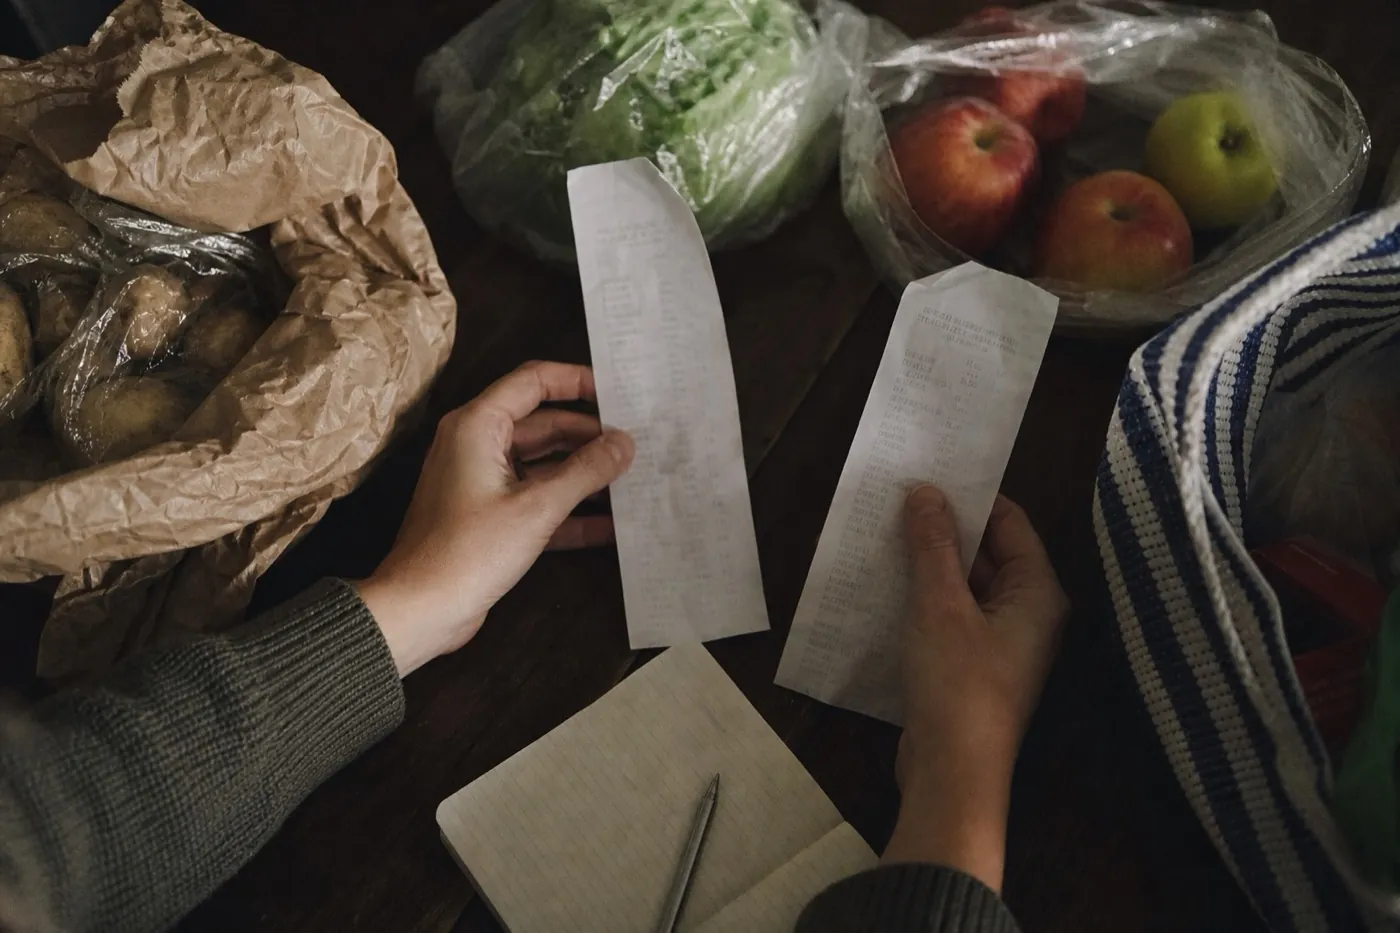
How do you compare grocery receipts from two months so the result means something?
To compare grocery receipts from two months, match the same products in the same pack size and work out separately the change in prices, the change in quantities and the purchases that cannot be matched. The difference between totals alone does not say whether things cost more, you bought more, or you bought something else. Here is the whole method with an example.
If April’s receipts come to more than March’s, it does not automatically mean everything got dearer. The gap usually has three sources. First, the same products cost something different. Second, the basket held different quantities of the same products. Third, one month includes things the other does not, such as a gift, a stock of coffee or party food.
What method do we use, and how does it differ from inflation?
The method: we match the same products and weights on receipts from two months, split the gap into a price effect (at the first month’s quantities) and a quantity effect (at the second month’s prices), and count the rest of the receipt separately. The numbers in the example are invented.
Public statistics measure the change in prices, not the size of anyone’s receipt. Poland’s statistics office (GUS) publishes Polish consumer price indices, and Eurostat’s HICP is an index of the change in prices of goods and services bought by households. Your comparison can work in a similar way if you match items first.
The result is still not an inflation rate. It covers a handful of products in your shops and your quantities, with no allowance for national spending patterns. For more on what official statistics measure, see our guide to what food price inflation measures.
GUS: Wskaźniki cenEurostat Statistics Explained: Consumer prices, inflationHow do you prepare the receipts for comparison?
Gather the grocery receipts from both months, ideally for the whole month, because single shops differ by chance. Preparing takes about an hour and you do it once, then only keep the table topped up.
- Copy the lines into one table: name, weight or volume, number of items, unit price, value.
- Match pairs. A pair is the same product in the same pack size in both months, for example a 500 g rye loaf from the same bakery.
- If the pack size changed, compare the price per kilogram. Directive 98/6/EC requires shops to show the unit price, so it is usually on the shelf label.
- Move everything you cannot match into a separate “other” group. Do not add those lines to the average, because they distort the picture of prices.
- Mark promotions. If coffee was on offer in March but not in April, the pair will show a big price change that is not lasting.
If a different loaf was in the basket in April, that is not a pair but two different products. Such a line goes into “other”, even if both loaves came from the same shop.
Dyrektywa 98/6/WE w sprawie ochrony konsumenta przez podawanie cen produktówHow do you split the gap into a price effect and a quantity effect?
The split needs two simple sums on the matched pairs. The first answers how much more you would have paid for March’s quantities at April’s prices. The second shows what the change in quantities cost at April’s prices.
Price effect = sum over pairs of (April price − March price) × March quantity. Quantity effect = sum over pairs of (April quantity − March quantity) × April price. Added together, the two effects give exactly the change in the value of the matched pairs, with nothing left over.
What does the split look like with invented numbers?
The numbers in the table are an example of the calculation, not shop data. In March the receipts total £64.00 and in April £80.00. The difference is £16.00, and we want to know where it came from.
| Line | March | April | Change |
|---|---|---|---|
| Bread (pairs) | 4 × £1.10 = £4.40 | 4 × £1.20 = £4.80 | +£0.40 |
| Milk (pairs) | 8 × £1.20 = £9.60 | 6 × £1.10 = £6.60 | −£3.00 |
| Cheese (pairs) | 2 × £2.00 = £4.00 | 3 × £2.10 = £6.30 | +£2.30 |
| Apples (pairs) | 3 kg × £2.00 = £6.00 | 3 kg × £2.00 = £6.00 | £0.00 |
| All pairs | £24.00 | £23.70 | −£0.30 |
| Other purchases | £40.00 | £56.30 | +£16.30 |
| Total on receipts | £64.00 | £80.00 | +£16.00 |
The price effect uses March quantities: bread 4 × 0.10 = +£0.40, milk 8 × (−0.10) = −£0.80, cheese 2 × 0.10 = +£0.20, apples 0. That comes to −£0.20, or −0.20 ÷ 24.00 = about −0.8%: the same basket was slightly cheaper.
The quantity effect uses April prices: milk (6 − 8) × 1.10 = −£2.20, cheese (3 − 2) × 2.10 = +£2.10, bread and apples unchanged. That is −£0.10. Add the two effects, −0.20 and −0.10, and you get exactly −£0.30.
The remaining £16.30 is the “other” group: £40.00 in March and £56.30 in April. In this example almost the whole gap between the receipts comes from different purchases, not from prices.
What do you do with the result of the split?
The result of the split suggests where to look for savings, but it does not settle the matter by itself. The three parts in the example lead to three different decisions, so first find out which one is biggest in your household.
You do not have to look in all three places at once. Pick one, check it next month and only then move on.
- A big price effect. Check whether the product got dearer in one shop or several. Compare the price per kilogram in a second shop before you change habits.
- A big quantity effect. See whether you buy more because you eat more, or because some of it ends up in the bin. A waste diary helps, as described in the guide to food waste figures.
- A big “other” group. Go through it line by line. You will usually find impulse buys, party food and things that are not food at all.
In the table example the “other” group explained the most, so the sum itself showed that prices were not the problem. It will not always turn out that way, but it is always worth checking before you start saving in the wrong place.
What can you conclude, and what will two months not tell you?
Two points are not a trend. One promotion, a holiday or a stock-up can move the result by a few per cent. Draw conclusions about direction only from a longer series. Four traps that most often spoil this kind of comparison.
- Season. Fruit and vegetables have seasonal prices. Comparing March with April for strawberries or new potatoes says mostly about the time of year. Eurostat explains that the annual rate compares the same month year on year, which removes part of that effect.
- A different shop. If April’s shopping was at another chain, the price effect mixes with a change of place. Keep pairs separate for each shop.
- Month boundaries. A big shop at the start or end of a month can fall into different periods. When comparing total value, counting weeks instead of calendar months helps.
- Your result is not inflation. It covers a few products in your shops and your quantities.
How do you turn receipts into a lasting routine instead of a one-off sum?
A one-off comparison teaches a lot, but repeating it every month teaches more. A few habits are enough to make later comparisons take a quarter of an hour instead of an evening.
Photograph the receipt straight after shopping and add the lines to the table each week. Keep one list of items you buy regularly and compare only that. After a few months you will see which prices are really rising and which jump because of promotions.
Longer observation of your own prices is covered in the guide to tracking your own shopping basket. If you buy the same product in different pack sizes, first convert them using the price per kilogram.
How does BuyNest make the comparison easier?
The comparison is easy when you shop from the same list every month. Save the items you repeat as a template, such as a list of lines to compare month to month, and add it at the start of the month. Quantities and pack sizes stay the same, so the pairs match themselves.
In the note on a product, write the price from the receipt. Items assigned to shops show where the shopping was done, and a shared list means other household members’ purchases end up in the same summary. Products from outside the list, bought on impulse, are then easy to drop into the “other” group.
Lines to compare month to month
- Bread and grains
- Bread note the weight4 loaf
- Pasta1 kg
- Rice1 kg
- Rolled oats500 g
- Dairy and eggs
- Milk8 l
- Eggs20 pcs
- Hard cheese400 g
- Butter400 g
- Plain yoghurt800 g
- Meat
- Chicken breast1 kg
- Fruit and veg
- Potatoes4 kg
- Onions1 kg
- Carrots1 kg
- Apples3 kg
- Store cupboard
- Coffee500 g
- Rapeseed oil1 l
Frequently asked questions
Does a bigger total on receipts mean prices went up?
Not necessarily. The total depends on prices, quantities and what you bought. Check pairs of the same products in the same pack size first, and only then judge the change in prices.
How many receipts do I need for the comparison to make sense?
Ideally all of them from the whole month. Single shops differ by chance, and a promotion or a stock-up can distort the result. The more pairs you have in both months, the firmer the sum.
How is my comparison different from an official inflation rate?
The GUS indices and Eurostat’s HICP measure changes in consumer prices across a whole country. Your comparison covers a few products in your shops and your quantities, so it does not replace official statistics.
What do I do if the pack size of a product changed?
Compare the price per kilogram or litre. Directive 98/6/EC requires a unit price, so you will usually find it on the shelf label. Without a label, work it out yourself: price ÷ weight.
Is it better to compare months or weeks?
Weeks give a more accurate picture, because a big shop at the edge of a month does not fall into the wrong period. Months are more convenient, but large shops at the start and end can distort the result.
Before you decide how to compare grocery receipts from two months, match pairs of products and work out the price effect and the quantity effect separately. Leave the rest of the receipt in the “other” group. Add a regular shopping list to BuyNest so that the next comparison takes a quarter of an hour.
Open the ready list in BuyNestMethod and criteria
Method: the same products and weights on two receipts, with the rest of the receipt kept separate. No inflation index.
Sources
Take the shopping into BuyNest
BuyNest is on iPhone and Android. The app has no ads, including on the free plan.